%
%                       heat_code.m
%
Code computes optimal parameters, the sensitivity matrices, and covariance matrix for the aluminum rod data analyzied in Example 7.16.
Required functions: heat_fun_al.m Required data: final_al_data.txt
  clear all
  close all

  global data_al xdata

%
% Load the data and construct the x datapoints.
%

  load final_al_data.txt

  data_al = final_al_data(2:16);
  xdata = [10 14 18 22 26 30 34 38 42 46 50 54 58 62 66];
  xvals = [10:.1:70];
  u_amb = final_al_data(17);
Input dimensions and material constants for the alumunim rod.
  a = 0.95;      % cm
  b = 0.95;      % cm
  L = 70.0;      % cm
  k = 2.37;      % W/cm C
  n = 15;        % Number of measurements
  p = 2;         % Number of parameters
Optimize parameters and construct increments used when approximating sensitivities using finite differences. The representations are truncated to two significant digits to remain consistent with the measured temperatures.
  h_init = 0.00183;
  Q_init = -15.93;
  q_init = [h_init Q_init];

  modelfun = @(q)heat_fun_al(q,a,b,L,k,u_amb);
  [q_opt,fval] = fminsearch(modelfun,q_init);

  h = q_opt(1);
  Q = q_opt(2);

  h = 0.00191;
  Q = -18.41;

  dh = 1e-10;
  dQ = 1e-4;
  h_p = h + dh;
  Q_p = Q + dQ;
Construct constants and analytic solution to the steady state heat equation.
  gamma = sqrt(2*(a+b)*h/(a*b*k));
  gamma_h = (1/(2*h))*gamma;
  f1 = exp(gamma*L)*(h + k*gamma);
  f2 = exp(-gamma*L)*(h - k*gamma);
  f3 = f1/(f2 + f1);
  f1_h = exp(gamma*L)*(gamma_h*L*(h+k*gamma) + 1 + k*gamma_h);
  f2_h = exp(-gamma*L)*(-gamma_h*L*(h-k*gamma) + 1 - k*gamma_h);
  c1 = -Q*f3/(k*gamma);
  c2 = Q/(k*gamma) + c1;
  f4 = Q/(k*gamma*gamma);
  den2 = (f1+f2)^2;
  f3_h = (f1_h*(f1+f2) - f1*(f1_h+f2_h))/den2;
  c1_h = f4*gamma_h*f3 - (Q/(k*gamma))*f3_h;
  c2_h = -f4*gamma_h + c1_h;
  c1_Q = -(1/(k*gamma))*f3;
  c2_Q = (1/(k*gamma)) + c1_Q;

  gamma_hp = sqrt(2*(a+b)*h_p/(a*b*k));
  f1_hp = exp(gamma_hp*L)*(h_p + k*gamma_hp);
  f2_hp = exp(-gamma_hp*L)*(h_p - k*gamma_hp);
  f3_hp = f1_hp/(f2_hp + f1_hp);
  c1_hp = -Q*f3_hp/(k*gamma_hp);
  c2_hp = Q/(k*gamma_hp) + c1_hp;

  c1_Qp = -Q_p*f3/(k*gamma);
  c2_Qp = Q_p/(k*gamma) + c1_Qp;

  uvals = c1*exp(-gamma*xvals) + c2*exp(gamma*xvals) + u_amb;
  uvals_data = c1*exp(-gamma*xdata) + c2*exp(gamma*xdata) + u_amb;
  uvals_Q_data = c1_Q*exp(-gamma*xdata) + c2_Q*exp(gamma*xdata);
  uvals_h_data = c1_h*exp(-gamma*xdata) + c2_h*exp(gamma*xdata) + gamma_h*xdata.*(-c1*exp(-gamma*xdata) + c2*exp(gamma*xdata));

  uvals_data_hp = c1_hp*exp(-gamma_hp*xdata) + c2_hp*exp(gamma_hp*xdata) +u_amb;
  uvals_data_Qp = c1_Qp*exp(-gamma*xdata) + c2_Qp*exp(gamma*xdata) + u_amb;

  S_d = [ones(1,15); xdata; xdata.^2; xdata.^3; xdata.^4];

  h_fd = (1/dh)*(uvals_data_hp - uvals_data);
  Q_fd = (1/dQ)*(uvals_data_Qp - uvals_data);

  res = data_al - uvals_data;
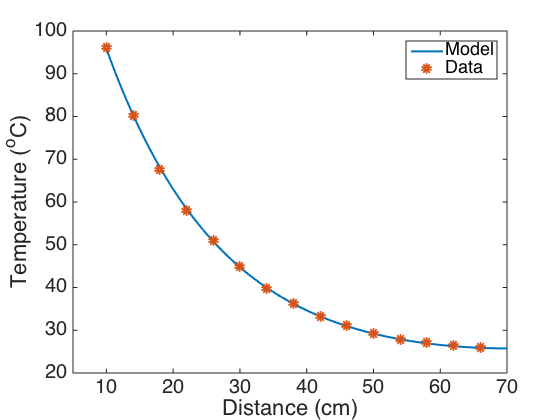
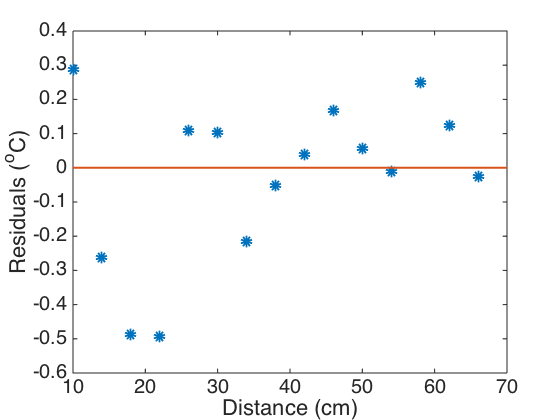
Plot the model fit and residuals.
  figure(1)
  plot(xvals,uvals,'linewidth',2)
  axis([5 70 20 100])
  hold on
  plot(xdata,data_al,'o','linewidth',5)
  hold off
  set(gca,'Fontsize',[20]);
  xlabel('Distance (cm)')
  ylabel('Temperature (^oC)')
  legend('Model','Data','Location','Northeast')

  figure(2)
  plot(xdata,res,'o','linewidth',6)
  axis([10 70 -.6 .4])
  hold on
  plot(xvals,0*xvals,'linewidth',2)
  hold off
  set(gca,'Fontsize',[20]);
  xlabel('Distance (cm)')
  ylabel('Residuals (^oC)')


Construct the analytic and finite difference sensitivity matrices.
  sens_mat = [uvals_Q_data; uvals_h_data]
  sens_mat_fd = [Q_fd; h_fd]

%
% Construct the measurment covariance sigma2 and the covariance matrices
% V and V_fd constructed using the analytic and finite difference
% sensitivity relations.
%
  format short e

  sigma2 = (1/(n-p))*res*res';
  V = sigma2*inv(sens_mat*sens_mat')
  V_fd = sigma2*inv(sens_mat_fd*sens_mat_fd')
sens_mat =

  Columns 1 through 6

  -4.0501e+00  -3.2100e+00  -2.5449e+00  -2.0187e+00  -1.6025e+00  -1.2738e+00
  -3.1056e+04  -2.8266e+04  -2.5323e+04  -2.2416e+04  -1.9666e+04  -1.7143e+04

  Columns 7 through 12

  -1.0145e+00  -8.1051e-01  -6.5075e-01  -5.2648e-01  -4.3093e-01  -3.5888e-01
  -1.4882e+04  -1.2897e+04  -1.1187e+04  -9.7437e+03  -8.5538e+03  -7.6028e+03

  Columns 13 through 15

  -3.0640e-01  -2.7063e-01  -2.4962e-01
  -6.8770e+03  -6.3645e+03  -6.0561e+03


sens_mat_fd =

  Columns 1 through 6

  -4.0501e+00  -3.2100e+00  -2.5449e+00  -2.0187e+00  -1.6025e+00  -1.2738e+00
  -3.1056e+04  -2.8266e+04  -2.5323e+04  -2.2416e+04  -1.9666e+04  -1.7143e+04

  Columns 7 through 12

  -1.0145e+00  -8.1051e-01  -6.5075e-01  -5.2648e-01  -4.3093e-01  -3.5888e-01
  -1.4882e+04  -1.2897e+04  -1.1187e+04  -9.7437e+03  -8.5538e+03  -7.6028e+03

  Columns 13 through 15

  -3.0640e-01  -2.7063e-01  -2.4962e-01
  -6.8770e+03  -6.3644e+03  -6.0561e+03


V =

   2.1034e-02  -2.0286e-06
  -2.0286e-06   2.0972e-10


V_fd =

   2.1034e-02  -2.0286e-06
  -2.0286e-06   2.0972e-10
Construct the 95% confidence intervals.
  tval = 2.1604;
  int_Q = [Q - sqrt(V(1,1))*tval  Q + sqrt(V(1,1))*tval]
  int_h = [h - sqrt(V(2,2))*tval  h + sqrt(V(2,2))*tval]

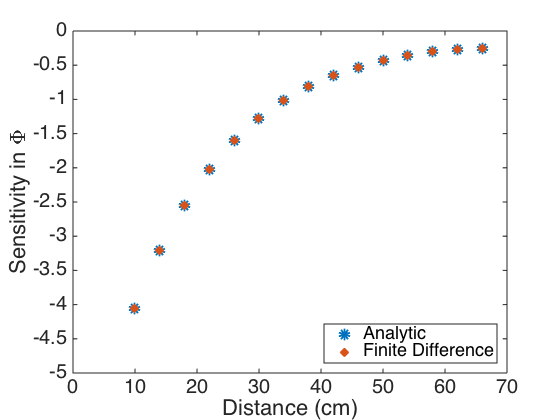
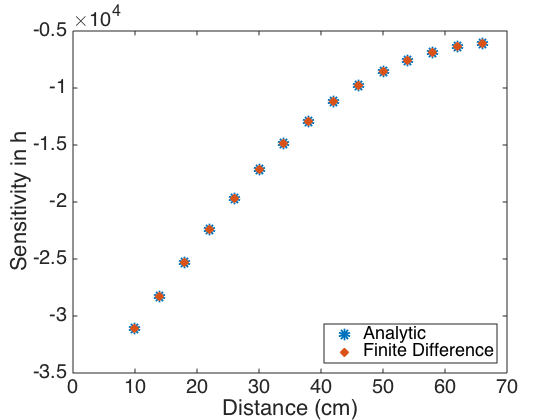
%
% Plot the sensitivities obtained analytically and using finite differences
% to show that to within visual accuracy, they are the same.
%

  figure(3)
  plot(xdata,uvals_Q_data,'o',xdata,Q_fd,'x','linewidth',6)
  axis([0 70 -5 0])
  set(gca,'Fontsize',[20]);
  xlabel('Distance (cm)')
  ylabel('Sensitivity in \Phi')
  legend('Analytic','Finite Difference','Location','Southeast')


  figure(4)
  plot(xdata,uvals_h_data,'o',xdata,h_fd,'x','linewidth',6)
  axis([0 70 -3.5e4 -0.5e4])
  set(gca,'Fontsize',[20]);
  xlabel('Distance (cm)')
  ylabel('Sensitivity in h')
  legend('Analytic','Finite Difference','Location','Southeast')
int_Q =

  -1.8723e+01  -1.8097e+01


int_h =

   1.8787e-03   1.9413e-03

