Contents
%
%             alias.m
%
%
Code used to generate the figures and ranks for Case ii: n = 101, p = 1000 for Example 6.11.
This can be easily modified for Case i: p = n = 5 or truncated for Case iii.
  clear all
  close all
Input the response and parameter dimensions. When using the Random Range Finding algorithm, we will use ell = 75 samples.
  n = 101;
  p = 1000;
  ell = 75;
  tol = 1e-15;
  h = 1/(n-1);
  t = 0:h:1;
Construct the matrix A and compute the singular values and QR matrices. Construct the random matrix Y and its QR decomposition.
  for i = 1:p
    A(:,i) = sin(2*pi*i*t);
  end

  [Q,R,P] = qr(A');
  [U,S,V] = svd(A);
  rankA = rank(A,tol)

  params = rand(p,ell);
  Y = A*params;

  [Qs,Rs,Ps] = qr(Y);
  B = Qs'*A;
  [Us,Ss,Vs] = svd(B);
rankA =

   100
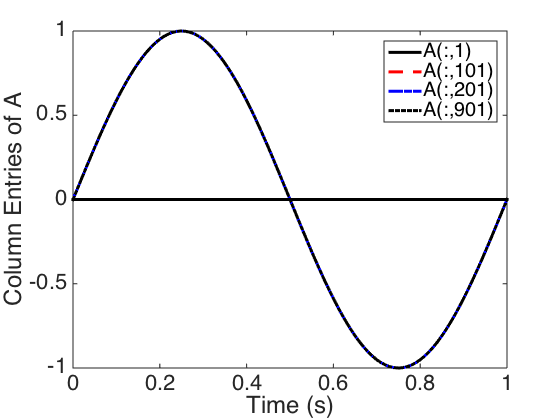
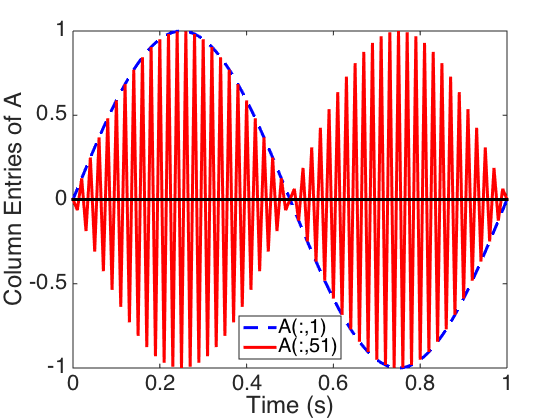
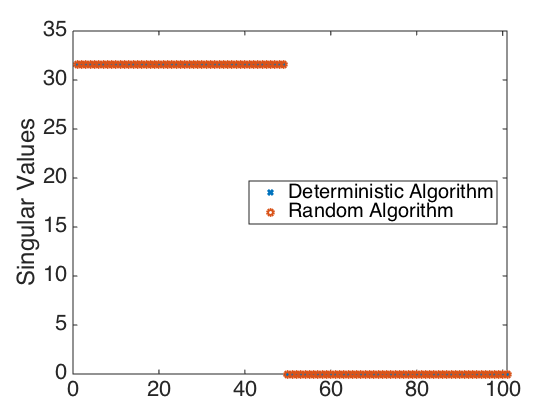
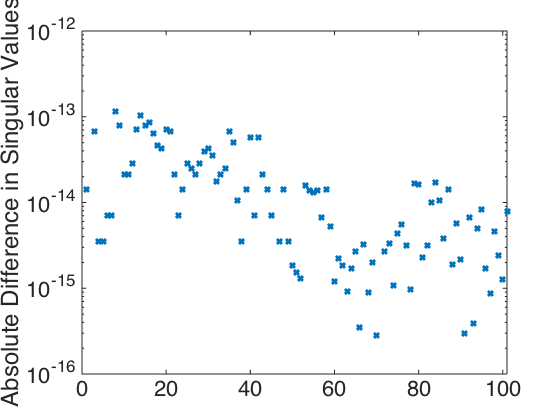
Plot the columns of A shown in Figure 6.4 and the singular values and errors shown in Figure 6.5.
  figure(1)
  plot(t,A(:,1),'-k',t,A(:,101),'--r',t,A(:,201),'-.b',t,A(:,901),':k','linewidth',3)
  hold on
  plot(t,0*t,'k-','linewidth',3)
  hold off
  set(gca,'Fontsize',[22]);
  xlabel('Time (s)')
  ylabel('Column Entries of A')
  legend('A(:,1)','A(:,101)','A(:,201)','A(:,901)','Location','NorthEast')

  figure(2)
  plot(t,A(:,1),'--b',t,A(:,51),'-r','linewidth',3)
  hold on
  plot(t,0*t,'k-','linewidth',3)
  hold off
  set(gca,'Fontsize',[22]);
  xlabel('Time (s)')
  ylabel('Column Entries of A')
  legend('A(:,1)','A(:,51)','Location','South')

  figure(3)
  plot(diag(S),'x','linewidth',3)
  axis([0 101 0 35])
  hold on
  plot(diag(Ss),'o','linewidth',3)
  hold off
  set(gca,'Fontsize',[22]);
  legend('Deterministic Algorithm','Random Algorithm','Location','East')
  ylabel('Singular Values')


  Sdiff = abs(diag(S) - diag(Ss));
  figure(4)
  semilogy(Sdiff,'x','linewidth',3)
  axis([0 101 1e-16 1e-12])
  set(gca,'Fontsize',[22]);
  ylabel('Absolute Difference in Singular Values')


